I left my wonderful, high-paying job with Berkeley Research Group in November 2016. I was part of their innovative Healthcare Analytics Practice, where I enjoyed crunching numbers, building software, and managing high-profile projects with our pharma and med device clients. Looking back on the experience, it was a nearly perfect place for me to be. I had access to GREAT data analysts, an incredibly supportive environment that encouraged analytical thinking, and plenty of oppurtunities for upward growth. I loved the variety of the consulting projects and mentoring new hires, BUT…I had an itch. I had to go.
There are three major reasons I left that November. Earlier that year, right before I got married, my father, who I consider to be a successful internet entrepreneur, said I should take more risks professionally. I think he probably felt I could achieve more on my own, and potentially, he knew what was waiting for me if I took the leap. While I tacitly and hestitantly agreed with him about taking on more risk, I felt that if the end goal was to make money, than it probably wasn’t worth it. At this point, I can definitely say that’s true. Despite earning more this year, I’m not convinced it was worth it for this reason alone. Which brings me to my second reason…
I wanted to maintain all of my intellectual property and earn an income commensurate to the effort/ingenuity I put into my work. I wanted to cut out the middleman, offer reasonable rates to my clients, while being able to pay myself something I felt was fair for the work involved. This felt liberating, but a bit bewildering because there were so many directions to proceed.
For example, as soon as I left, I partnered with two startups (via founders I knew) and started executing on contracts which involved the development of a native iOS market access1 application for a large pharma client, and managing a Net Pricing Calculator2 for a higher education consultancy. I also developed an “in-house” application to track my hours on various consulting projects, that I’ve used all year (basis for visuals below). Finally, I reached out to contacts, re-framed my position as an “available” consultant for hire, developed a client pipeline, and paid special attention to the most important part of being independent, in my opinion: communication. That’s still huge - stay in front of your clients!
Honestly, what I didn’t expect was the bouts of loneliness you experience when working on your own. So I joined a co-working community in Cambridge when my wife and I moved up here in June, and I think that’s helped. Finally, I was free to draw up contracts that preserved my IP, where possible.
The third reason was to try and shift my revenue from consulting to product. As a software developer I see plenty of oppurtunities to help clients who share the SAME EXACT issues; however, I feel an antagonistic relationship between consulting and software development. I can remember a handful of times throughout my consulting career where I was actively discouraged to develop a product for a client problem because “consulting” around the problem would be more profitable; but that just felt wrong in some cases. “Why automate an issue when you can throw bodies at it, right?” Not sure I agree. Consultants earn money by billing thier time; software can cut down on time needed and save clients money. At the end of the day, the right solution is a hybrid approach, where consultants handle tough edge cases and software automates the tedious. At any rate, I’m still working on the revenue shift, but it’s only been a year :).
Anyways, I think I promised you some vizzes about my first year out. Unfortunately, I can’t share exact numbers, but I thought “hovering” around the numbers could be instructive. Let’s take a look at my billable projects for 2017.
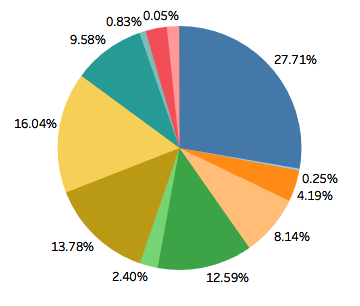
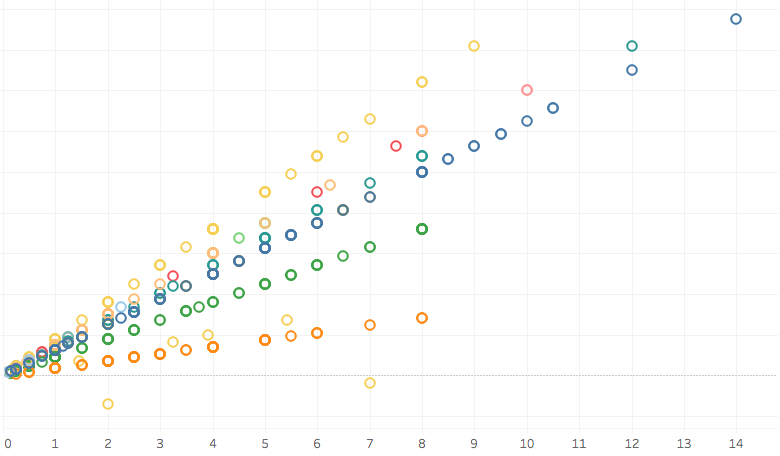
In 2017, I was contracted to work on 13 projects, a mix of traditional consulting work and development projects over the course of ~1,500 hours of work or so. I worked on two side projects that brought in some additional revenue not accounted for here. About a quarter of my profits came from one “mega” project, which helped me stablize income for the year - that felt nice. Let’s see a scatter plot of hours logged for each of the projects in 2017.
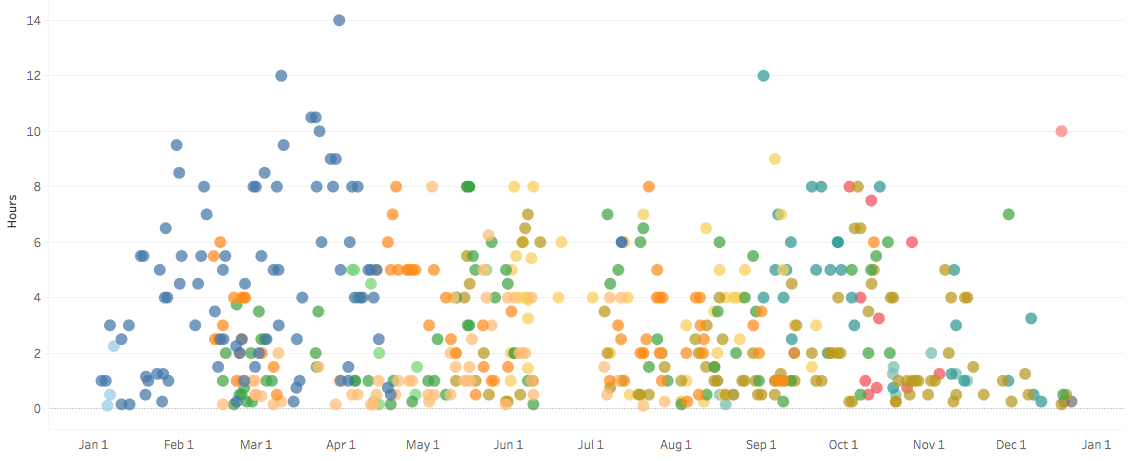
So I took a trip to Cambodia to visit my family in mid-June/early July. Looks like I logged some hours in Phnom Penh, but for the most part stuck to my guns and took the time off. I also took time off in mid-March to visit Portugal, but looks like I had some trouble staying away from one project. That’s the project that also accounted for a quarter of my income this year - it was clearly intense at the beginning of the year, with a hand full of 8+ hour days. Interestingly, two of my projects with my lowest rates (the dark green and dark orange) had the most consistent billing over the year, which provided me a little stability. Together, they accounted for about 17% of my total income. I wonder how many times I worked 10+ hours….
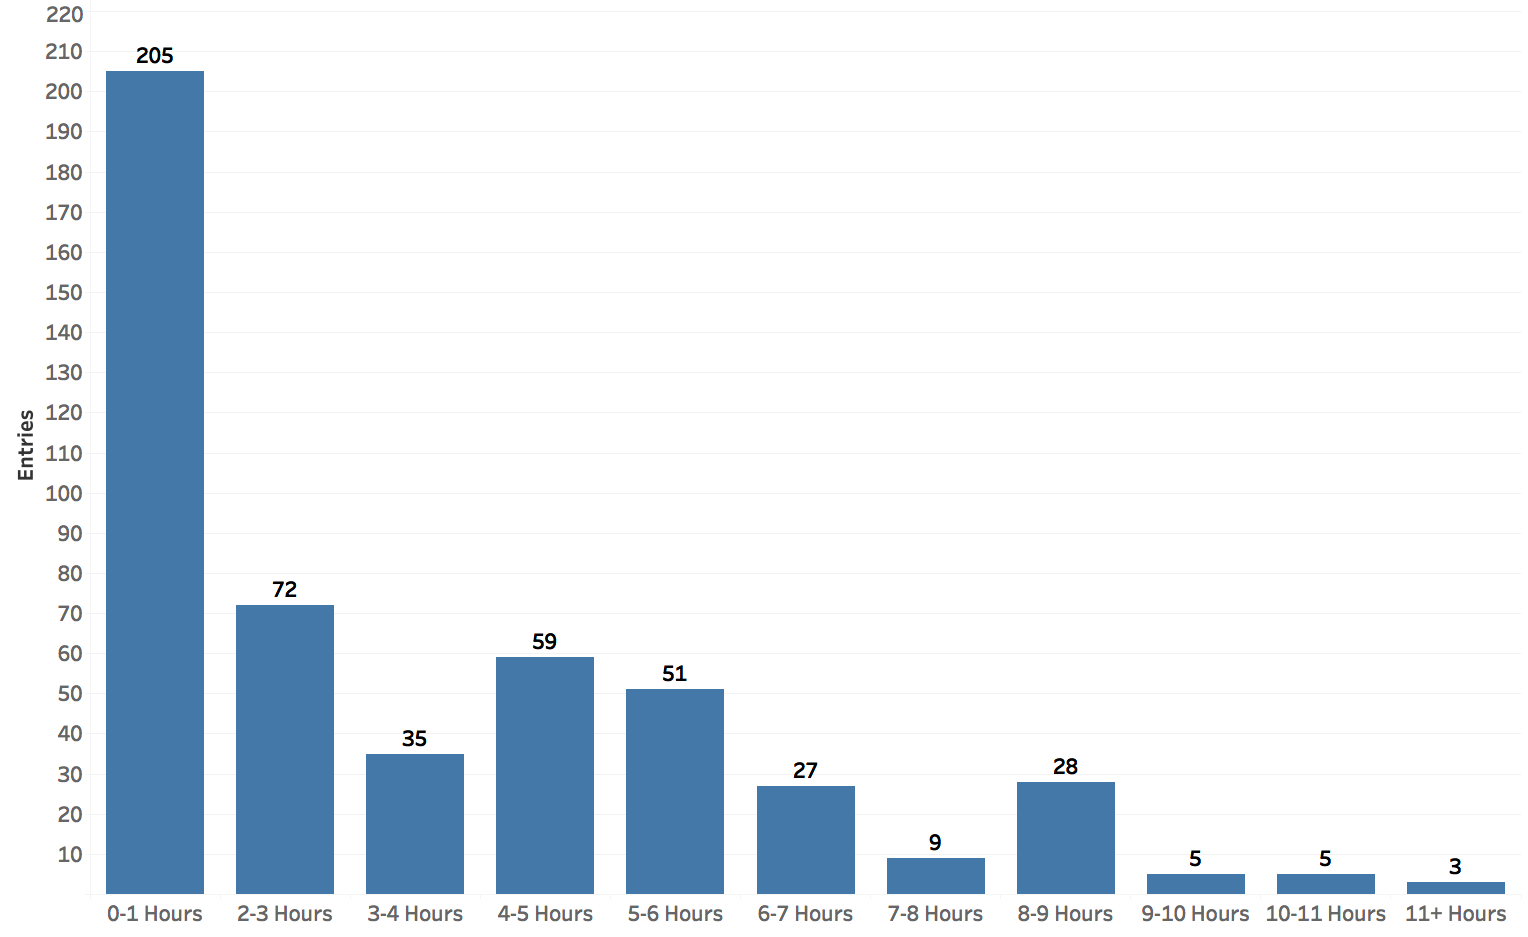
Unfortunately, this is not the number of days I worked 11+ hours, but rather the number of times I entered a time increment in one of these buckets. I apparently like small fractions. I wonder what a dual-axis area chart of my hours and profit will look like over time…
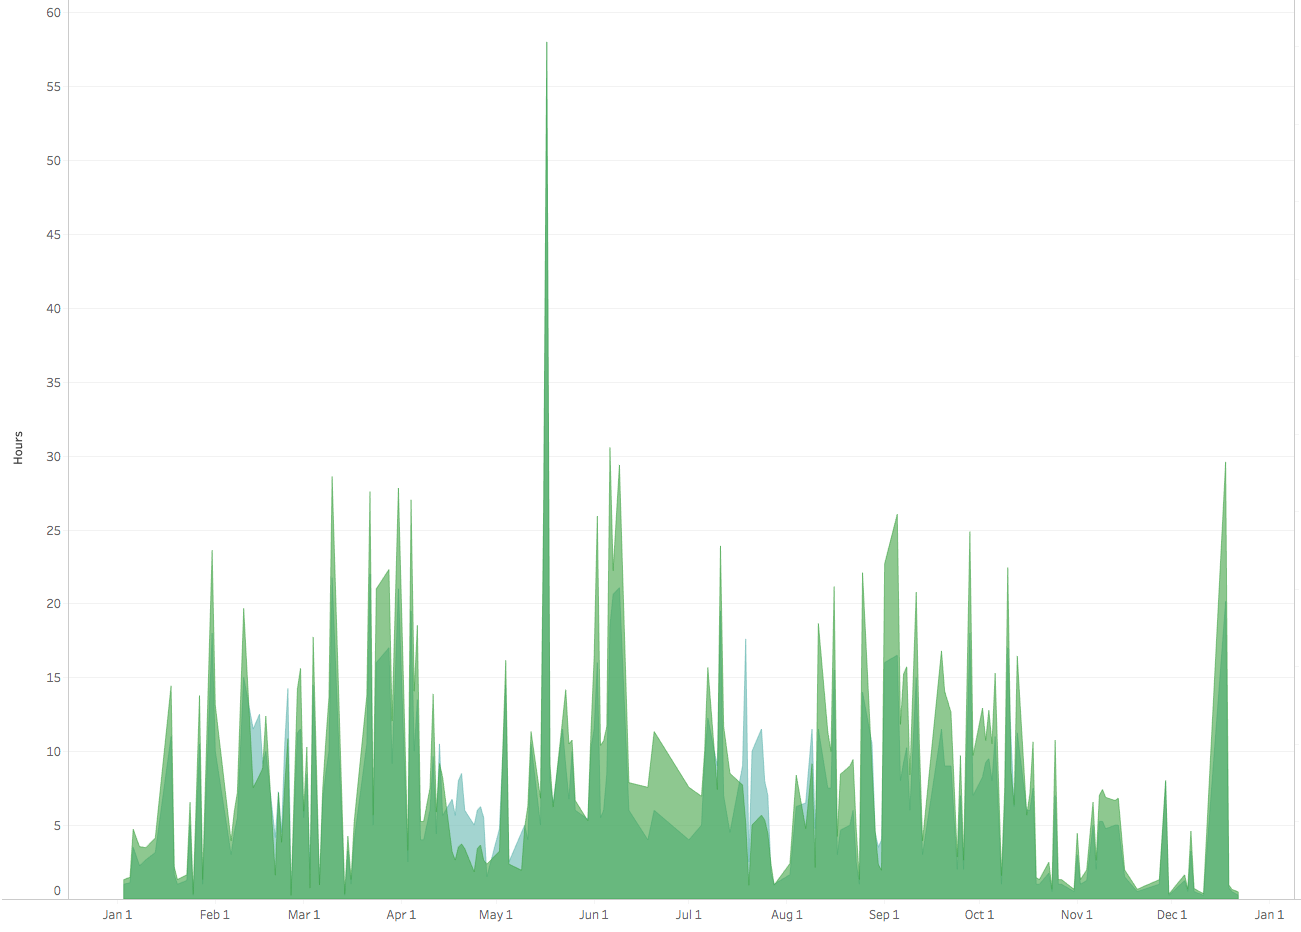
I’ve cropped the right axis, which is profit (in green), but you get the point. Hours are in blue. For the most part, the effort I put into my work directly related to profit (duh). You can see areas of blue on lower margin projects in the mid-April/late-July timeframe. Luckily, one of these lower margin projects is tied to royalties based on sales of the product, so the investment may be worth it! For the most part, I carried low overhead and only used subcontractors on a few projects, so my margins are fairly healthy. You’ll notice a couple of anomalies for some days here - those are profit anomalies, not hourly anomalies. I probably just billed a lot of time on a higher-rate project, or realized revenue on a fixed-fee project.
Again, cropped out profit on the left hand side, but basically you can see effective rates (e.g. profit/hours) for all my projects. The spectrum of rates is pretty tight. The project in yellow was my highest rate, which includes some negative profit (read: costs), where I worked with some sub-contractors occasionally. Strikingly, the higher rate projects also tend to have more entries with 8+ hour days. That’s interesting to know. The more expensive you are the more intense your days, and shorter the projects. The lower rate projects are more consistent and appear to be less volatile.
To all my clients, THANK YOU. Here’s to 2018.
That’s a wrap! Anything else you want to see / did I make any errors? Leave a comment below. I love subscribers - sign up on the right! If you’re interested in the time tracking software I used, check out WorkDive.